

We’re All in This to Get There
2026: Are We There Yet?
"As returning scholars might remember, some big projects take much too long to finish—high speed rail in California, the Haunted Chocolatier, these outlines. Some never get there at all. Explore the following examples of projects that weren’t finished on time, then discuss with your team: What factors, if any, did these delays have in common? How would you have overcome them? And are there projects out there in the world today that you predict will suffer a similar fate?"
La Sagrada Familia (Spain):
-
La Sagrada Família is a large Catholic basilica in Barcelona, Spain that has been under construction since 1882
-
This makes it the oldest active construction project in the world.
-
The church was designed by the famous Spanish architect, Antoni Gaudí, who devoted much of his life to the project.
-
Gaudí knew the project would take many years and often said, “My client is not in a hurry.”
-
Construction slowed and stopped at times, especially during the Spanish Civil War, but workers continued the project after those interruptions.
-
The building became the world’s tallest church in late 2025 and early 2026, reaching a height of about 172.5 meters, surpassing other tall churches.
-
In January 2025, Guinness World Records confirmed that La Sagrada Família is the oldest active construction site still being built and said it is expected to be finished in 2026 after 144 years of work.
-
On 20 February 2026, workers completed the external structure of the central “Tower of Jesus Christ,” marking a major milestone in the basilica’s construction, although some interior work will continue.
-
The church combines Gothic and Art Nouveau design elements, making it one of the most unique architectural works in the world.
-
Even after it reaches its final height and main structure is finished, some decorative elements and details may continue into the 2030s.
Nusantara Capital City (Indonesia):
-
Nusantara is the planned new capital of Indonesia, located in East Kalimantan on the island of Borneo, meant to replace Jakarta.
-
The capital project was originally launched by former president Joko Widodo (Jokowi) as a vision for a sustainable city to distribute economic growth more evenly across the country.
-
Under the new president Prabowo Subianto, the project lost political momentum in speeches and policy decisions.
-
Prabowo’s government reduced funding for Nusantara significantly, focusing instead on food security, energy independence, and defense.
-
Prabowo described Nusantara as a “symbolic capital,” suggesting he does not intend to fully move the government there but also avoids publicly ending the project.
-
Economists had doubts about Nusantara’s economic impact even before the shift, because Indonesia’s main economic activity remains concentrated on the islands of Java and Sumatra.
-
The situation shows how political leadership changes can weaken or abandon large development projects.
Ryugyong Hotel (North Korea):
-
The Ryugyong Hotel is a massive pyramid-shaped skyscraper in Pyongyang, North Korea.
-
Construction began in 1987, intended to be a luxury hotel and a symbol of North Korea’s modernity.
-
It is 105 stories tall, reaching about 330 meters, making it one of the tallest hotels in the world.
-
The project faced delays and setbacks due to economic problems and the collapse of the Soviet Union.
-
Construction stopped in 1992 for many years, leaving the building as an empty concrete shell.
-
Work resumed in the 2000s with foreign investment and modern materials, but the interior is reportedly still unfinished.
-
The hotel has been called the “Hotel of Doom” because of its long abandonment and incomplete status.
-
Despite its unfinished state, it dominates Pyongyang’s skyline and serves as a symbol of political propaganda.
-
Its purpose has shifted over time from luxury accommodation to a symbolic landmark, demonstrating North Korea’s engineering and architectural goals.
Wonderland Amusement Park (China):
-
Wonderland Amusement Park is an unfinished theme park located in Chengdu, China, that was intended to be one of the country’s largest amusement parks.
-
Construction began in the 1990s, and the park was planned to include rides, entertainment areas, hotels, and large themed zones, similar in style to Disneyland.
-
The project ran into financial problems, including insufficient funding, mismanagement, and disagreements over land use, which caused work to stop before completion.
-
Today, the park remains abandoned, with partially built structures, empty foundations, and incomplete rides.
-
It has become a popular site for urban explorers, photographers, and tourists interested in abandoned or “ghost” projects.
-
The park is sometimes called the “Chengdu Disneyland that never was” because of its ambitious plans and its resemblance to Western-style theme parks.
Berlin Brandenburg Airport (Germany):
-
Berlin Brandenburg Airport (BER) is the main international airport serving Berlin, Germany.
-
The airport was originally planned to replace Berlin’s older airports, including Tegel Airport and Schönefeld Airport.
-
Construction began in 2006, and the airport was originally expected to open in 2011.
-
However, the project experienced major delays due to engineering mistakes, safety issues, and management problems.
-
One of the biggest issues was the fire safety and smoke ventilation system, which had to be redesigned multiple times.
-
The airport became famous as a symbol of construction failure in Germany, because the opening was postponed many times.
-
Costs increased dramatically, rising from about €2 billion to more than €7 billion by the time it was finished.
-
After almost a decade of delays, the airport finally opened in October 2020.
-
BER is designed to handle tens of millions of passengers per year, serving as a major hub for flights in Europe.
Milan Cathedral (Italy):
-
Milan Cathedral, also called Duomo di Milano, is the main Catholic cathedral in Milan, Italy and one of the largest churches in the world.
-
Construction began in 1386 under the rule of Gian Galeazzo Visconti, who wanted to create a grand cathedral for the city.
-
The building took almost six centuries to complete, with work continuing until the 1900s.
-
The cathedral is famous for its Gothic architecture, with pointed arches, detailed sculptures, and over 100 spires rising from the roof.
-
It is built mainly from white and pink marble, which gives the building a bright appearance.
-
One of the most famous features is the golden statue of the Virgin Mary, called the Madonnina, placed on the tallest spire.
-
Inside the cathedral are large stained-glass windows, statues, and detailed carvings that tell stories from the Bible and Christian history.
-
The cathedral can hold tens of thousands of people, making it one of the largest churches in Europe.
-
Visitors can walk on the roof terraces, where they can see the spires and views of the city of Milan.
Crazy Horse Memorial (South Dakota):
-
Crazy Horse Memorial is a large mountain sculpture in the Black Hills of South Dakota.
-
The monument honors Crazy Horse, a Native American leader who fought to protect the lands and culture of his people.
-
The project began in 1948, started by the sculptor Korczak Ziolkowski at the request of Lakota leaders.
-
The monument is carved directly into a granite mountain and is planned to show Crazy Horse riding a horse and pointing toward his land.
-
When finished, it will be much larger than nearby monuments, including Mount Rushmore.
-
Construction has taken many decades because the project is funded mostly by private donations rather than government money.
-
Only the face of Crazy Horse has been completed so far, which was finished and dedicated in 1998.
-
The full design will include the horse’s head, the rider’s body, and the extended arm, making it one of the largest sculptures in the world.
-
The memorial also includes a museum and cultural center that teaches visitors about Native American history and culture.
"The science of project management aims to prevent delays and failures like those above. And, while it’s only been formally studied in recent centuries, project management itself isn’t a new concept. The makers of the Egyptian pyramids had to deploy a large workforce. China built a notable wall. The Romans devised their roads. Medieval cathedrals reached breathtaking heights. All of these things were complex operations that had to be managed somehow. Consider the history of project management, then discuss with your team: are such megaprojects harder to build now than in the past?"
-
Project management has existed for thousands of years, used in ancient construction projects like the Great Pyramid of Giza and the Great Wall of China.
-
Henry Gantt created the Gantt Chart to visualize project tasks and timelines.
-
In the 1950s, Critical Path Method (CPM) and PERT were developed to manage complex project schedules.
-
The Project Management Institute (PMI) was founded in 1969 and later published the PMBOK guide for professional standards.
-
Waterfall and Agile are major project management methods; Agile allows flexibility, while Waterfall is step-by-step.
-
Modern project management uses digital tools, software, and data analysis to improve planning.
"The makers of the pyramids might have benefitted from a Gantt chart—an approach invented in the early 20th century which shows a project schedule in the form of a bar chart. Some bars represent tasks that can be worked on at the same time; others need earlier bars to be completed before you can start on them. Explore how Gantt Charts helped in the construction of the Hoover Dam in the United States and how they even became popular in the early Soviet Union, then discuss with your team: what is gained when you translate a project into this kind of format—and what is lost?"
-
A Gantt chart is a visual project management tool that shows a project schedule as a horizontal bar chart.
-
Each bar represents a task, showing its start date, duration, and end date on a timeline.
-
Tasks are listed down the vertical axis, while time intervals (such as days, weeks, or months) run across the horizontal axis.
-
Gantt charts also show task dependencies, meaning which tasks must be completed before others can begin.
-
They can display milestones, which are major dates or goals in the project, and progress bars that show how much of each task has been completed.
-
The main purpose of a Gantt chart is to help project managers plan, schedule, and track tasks and deadlines, making projects easier to understand.
-
Gantt charts are especially useful for projects with strict timelines and multiple dependent tasks, such as construction or engineering projects.
-
Gantt charts are often created using software tools or templates in programs like Excel, and many project management platforms (such as ClickUp or Monday.com) include built‑in Gantt chart views.
-
While they can take time to set up, Gantt charts provide a visual overview of project tasks and timeframes that supports planning.
"Sleep, study, and a social life: choose two, because you can’t have all three. At least, that’s what an old student proverb would have us believe. There is a similar “Iron Triangle” in project management: scope, time, and cost. You can do something faster, but it’ll cost more or be smaller in scale. You can do something bigger, but it’ll take more time or cost more. You can do something more cheaply, but it’ll end up slower or smaller. Explore the tools below for navigating these pressures, then discuss with your team: are there times when we might want something to be smaller, slower, or more expensive?"
Kanban:
-
Kanban is a visual system for managing work, often used in project management and software development.
-
It was originally developed by Toyota in the 1940s to improve manufacturing and workflow in production lines.
-
Kanban uses boards and cards to represent tasks and their stages, such as “To Do,” “In Progress,” and “Done.”
-
It helps teams see work in progress and manage priorities in real time.
-
The method limits work in progress to avoid overloading team members and improve focus.
-
Kanban promotes continuous improvement, allowing teams to adjust processes based on workflow.
-
It is widely used in software development and personal productivity, but can be applied to any type of project.
-
The visual nature of Kanban makes it easy to identify bottlenecks, delays, and areas that need attention.
Gantt Charts:
-
A Gantt chart is a visual tool used in project management to show a schedule of tasks over time.
-
It was developed in the early 1900s by Henry Gantt.
-
A Gantt chart uses horizontal bars to represent each task in a project.
-
The length of each bar shows how long the task will take.
-
Tasks are listed on the vertical axis, while time (days, weeks, or months) is shown on the horizontal axis.
-
It helps project managers plan tasks, assign work, and track progress during a project.
-
Gantt charts can also show task dependencies, meaning some tasks must be finished before others can start.
-
They often include milestones, which mark important events or goals in the project timeline.
Harmonogram:
-
A harmonogram is a schedule or timeline used to organize tasks and activities in a project.
-
It shows when each task should start and finish so the project stays on track.
-
Harmonograms help teams plan work in an organized order and avoid delays.
-
They often include important deadlines and milestones for the project.
-
A harmonogram can be shown in different formats, such as tables, calendars, or charts.
-
It is commonly used in project management, research, and business planning.
-
The main purpose of a harmonogram is to coordinate tasks and make sure the project is completed efficiently.
Dependencies:
-
Dependencies are relationships between tasks where one task depends on another in being completed first.
-
They help determine the correct order of tasks in a project schedule.
-
Dependencies are important because some tasks cannot start until other tasks are finished.
-
For example, in construction, the foundation must be built before the walls can be constructed.
-
Identifying dependencies helps project managers avoid delays and organize work efficiently.
-
Dependencies are often shown in project schedules and charts, such as Gantt Chart.
Risk Register:
-
A risk register is a document used in project management to identify and track possible risks in a project.
-
It lists potential problems that could affect the project, such as delays, budget issues, or technical failures.
-
Each risk is described along with its likelihood and possible impact on the project.
-
The risk register also includes plans to reduce or manage the risks if they occur.
-
Project managers use it to monitor risks and prepare solutions before problems happen.
-
The document is updated regularly during the project as new risks appear or existing risks change.
Stakhanovite Movement:
-
The Stakhanovite Movement was a 1930s Soviet campaign that encouraged workers to produce much more.
-
It was named after Alexey Stakhanov, who reportedly mined a record amount of coal in one shift in 1935.
-
The movement was strongly supported by the Soviet Union as propaganda to promote hard work.
-
Workers who exceeded production goals were called “Stakhanovites” and were praised as heroes of socialist labor.
-
They often received rewards, better pay, and public recognition for their high productivity.
-
The movement was part of Joseph Stalin’s industrialization efforts to increase factory and mining output.
-
Some historians believe the records were exaggerated to encourage other workers to work harder.
Critical Path Method:
-
The Critical Path Method (CPM) is a project management technique used to plan and schedule different projects.
-
It was developed in the 1950s to help manage large industrial and engineering projects.
-
CPM identifies the longest sequence of tasks that must be completed on time for the project to finish on schedule.
-
This sequence is called the critical path because any delay in these tasks will delay the entire project.
-
The method helps project managers prioritize important tasks and manage time efficiently.
-
CPM also shows dependencies between tasks, meaning which tasks must be finished before others can begin.
-
It is often used together with Gantt Chart to visualize project schedules.
Program Evaluation and Review Technique:
-
Program Evaluation and Review Technique (PERT) was developed in the 1950s by the U.S. Navy.
-
It was made to help manage the Polaris missile program.
-
PERT focuses on estimating how long project tasks may take, especially when the exact time is uncertain.
-
It uses three time estimates for each task: the optimistic time, the most likely time, and the pessimistic time.
-
These estimates help calculate a more realistic expected completion time for the project.
-
PERT also shows task dependencies, meaning which tasks must be completed before others can begin.
-
The method is useful for larger projects where many activities happen at the same time.
"YouTube began as a dating website; Netflix used to mail people movie rentals on DVDs; Amazon started out selling
books and now leads the world in cloud computing. Even the project management software juggernaut Slack began
as a chat feature inside a video game. Where many large companies in the 20th century planned every step of their
projects in advance, today expectations have shifted away from perfectly sequenced plans to faster pivots between
products and even business models. Explore this shift, then discuss with your team: is it better to have a rigid map
that might be wrong or no map at all and a very fast pair of shoes?"
Waterfall method:
-
The Waterfall method is a project management approach where tasks are completed in a fixed, step-by-step order.
-
Each phase must be fully finished before the next phase begins.
-
Typical stages include planning, design, development, testing, and completion.
-
It is called “waterfall” because the process flows downward from one stage to the next, like water falling.
-
The method works best when project requirements are clear from the beginning.
-
It is commonly used in construction, engineering, and some software development projects.
-
One disadvantage is that it is less flexible, because changes are difficult to make once a phase is completed.
-
The Waterfall method was widely used in the 1970s and 1980s before more flexible methods became popular.
Command-Control:
-
Command-and-control is a management style where leaders make decisions and give clear instructions to workers.
-
Authority is centralized, meaning most decisions come from the top level of leadership.
-
Workers are expected to follow orders and complete tasks exactly as instructed.
-
This system focuses on strict organization, discipline, and clear chains of command.
-
It is commonly used in military organizations and large hierarchical institutions.
-
The approach can help quick decision-making in urgent situations.
-
However, it may limit creativity and flexibility, since workers have less freedom to make their own decisions.
Toyota Production System:
-
The Toyota Production System (TPS) is a manufacturing system developed by Toyota after World War II.
-
It was mainly developed by Taiichi Ohno and Eiji Toyoda.
-
The system focuses on producing high-quality products while reducing waste and improving efficiency.
-
One key idea is “just-in-time” production, which means parts are made only when they are needed.
-
Another important principle is continuous improvement, where workers constantly look to improve the process.
-
TPS also encourages workers to stop production if they find a problem, so mistakes can be fixed immediately.
-
The system aims to reduce wasted time, materials, and effort in manufacturing.
-
The Toyota Production System later influenced modern Lean manufacturing methods used by different companies.
Chaos Engineering:
-
Chaos engineering is a method used in software engineering to test how systems respond to failures.
-
Engineers intentionally create small failures or disruptions in a system to see how it reacts.
-
The goal is to identify weaknesses and improve reliability before real problems occur.
-
It helps teams understand how complex systems behave under stress or unexpected conditions.
-
Chaos engineering is commonly used in large cloud computing systems and online services.
-
For example, engineers might shut down or slow part of the system to see if the rest of the system continues working.
-
The approach became popular at Netflix, which created a tool called Chaos Monkey to randomly disable parts of its system.
-
By testing failures in advance, chaos engineering helps companies build more stronger technology systems.
Agile Manifesto:
-
The Agile Manifesto is a set of principles for collaborative project management, especially in software development.
-
It was created in 2001 by a group of software developers who wanted a faster and more adaptable way to build software.
-
The manifesto values individuals and interactions over strict processes and tools.
-
It values customer collaboration over contract negotiation.
-
It encourages responding to change rather than following a fixed plan.
-
Agile methods focus on small, repeated cycles of work, often called iterations or sprints.
-
The Agile Manifesto helped inspire many modern project management frameworks such as Scrum and Kanban.
Six Sigma:
-
Six Sigma is a method used by companies to improve quality and reduce mistakes in processes.
-
It was developed in the 1980s at Motorola to improve manufacturing performance.
-
The goal of Six Sigma is to reduce defects and make processes more efficient and consistent.
-
The method uses data, statistics, and careful measurement to find problems in a process.
-
A common Six Sigma process is DMAIC, which stands for Define, Measure, Analyze, Improve, and Control.
-
Employees working in Six Sigma programs are trained with levels such as Yellow Belt, Green Belt, and Black Belt.
-
Six Sigma was later widely used by companies such as General Electric to improve business operations.
Sashimi Model:
-
The Sashimi Model is a software development process, similar to the Waterfall Model but allows stages to overlap.
-
It was proposed by Peter DeGrace and Leslie Hulet Stahl in their book Wicked Problems, Righteous Solutions.
-
The name “Sashimi” comes from the overlapping slices of raw fish in Japanese cuisine
-
This represents the overlapping phases of development.
-
In this model, stages such as design and testing can happen at the same time.
-
This overlap allows teams to find problems earlier and make improvements faster.
-
The Sashimi Model adds more flexibility and communication between stages.
-
It is mainly used to explain alternative ways to organize software development processes.
The Three Ways:
-
The Three Ways is a set of principles used in modern IT and software development, especially in DevOps practices.
-
The idea comes from the book The Phoenix Project by Gene Kim, Kevin Behr, and George Spafford.
-
The First Way focuses on flow, which means making work move smoothly and quickly from development to delivery.
-
The Second Way focuses on feedback, meaning teams constantly check for mistakes to improve the system.
-
The Third Way focuses on continuous experimentation, encouraging teams to test ideas and improve processes over time.
-
The Three Ways help organizations build better software, reduce errors, and improve collaboration between teams.
“The Phoenix Project” Philosophy
-
The Phoenix Project is a book about improving how organizations manage technology projects and IT systems.
-
It was written by Gene Kim, Kevin Behr, and George Spafford.
-
The book teaches the philosophy that IT and business teams must work together to deliver products effectively.
-
It explains that organizations should focus on improving workflow and managing system constraints.
-
The philosophy emphasizes communication and continuous improvement across teams.
-
It introduces the concept of The Three Ways, which guide better software development and operations practices.
-
The story shows how modern IT organizations can improve by using ideas from DevOps and systems thinking.
"Even before Gantt charts and the waterfall method, there was Frederick Taylor’s Principles of Scientific Management. Taylor
thought of workers as gears in a machine; he used stopwatches to measure the “one best way” to get to the end of a task.
Explore the related concepts below, then discuss with your team: in our age of algorithmic management and remote work
monitoring, have we returned to the “stopwatch” era? How would you want to be managed?"
-
The Principles of Scientific Management is a book written by Frederick Winslow Taylor in 1911.
-
The book explains scientific management, a system that studies work carefully to make jobs more efficient and productive.
-
Taylor believed that many workplaces were inefficient because workers used old habits and guesswork instead of tested methods.
-
He argued that work should be studied scientifically, using observation and measurement to find the best way to perform each task.
-
One idea in the book is that workers sometimes slow down their work intentionally, which Taylor called “soldiering.”
-
Taylor proposed four main principles of scientific management.
-
The first principle is to replace rule-of-thumb methods with scientific methods for each job.
-
The second principle is to carefully select and train workers so they can perform their jobs efficiently.
-
The third principle is to encourage cooperation between managers and workers instead of conflict.
-
The fourth principle is to divide responsibility between management and workers, where managers plan the work and workers carry it out.
-
Monitoring measures are ways organizations collect information about employees’ work and performance, especially when people work remotely.
-
Monitoring has become more common with hybrid and remote work, where employees work partly from home.
-
Some common monitoring methods include tracking time spent on laptops, measuring billable work hours, and checking work saved in shared cloud folders.
-
Organizations may also use task management or time-tracking software to understand productivity.
-
Many managers are divided on how much monitoring is acceptable, and about 39% believe none of the monitoring measures are acceptable.
-
The most accepted measures usually focus on productivity or employee wellbeing, such as identifying signs of burnout.
-
Less accepted practices include random screenshots or recording employees’ screens, because they may collect too much personal data.
Taylorism and the Four Principles:
-
Taylorism is a theory of management developed by Frederick Winslow Taylor in the early 1900s.
-
It is based on the idea that work can be studied scientifically to improve efficiency and productivity.
-
Taylor believed managers should analyze tasks carefully and find the most efficient way to perform each job.
-
This system became known as scientific management and influenced modern industrial workplaces.
-
The first principle is to replace rule-of-thumb work methods with scientifically studied methods.
-
The second principle is to carefully select, train, and develop workers so they can perform their jobs efficiently.
-
The third principle is to encourage cooperation between managers and workers to follow the best methods.
-
The fourth principle is to divide work responsibilities, where managers plan and organize tasks and workers carry them out.
Max Weber’s Bureaucracy:
-
Max Weber developed the idea of bureaucracy as a way to organize large institutions efficiently.
-
He studied how organizations could be structured to make decision-making clear and consistent.
-
In a bureaucracy, there is a clear hierarchy, meaning authority flows from top leaders down to lower levels.
-
Jobs are divided into specialized roles, where each worker has specific responsibilities.
-
Decisions and actions are based on formal rules and procedures rather than personal opinions.
-
Bureaucracies use written records and documentation to track work and maintain organization.
-
Workers are expected to be professional, treating people equally rather than based on personal relationships.
-
Weber believed bureaucracy could make organizations more stable and efficient, especially in governments and large companies.
Ford Assembly Line:
-
The Henry Ford developed the assembly line in the early 1900s to mass-produce cars efficiently.
-
The assembly line allowed workers to stay in one place while the product moves along a conveyor, completing specific tasks repeatedly.
-
This method reduced production time, lowered costs, and made cars like the Model T affordable for more people.
-
It divided work into small, specialized tasks, which made things faster.
-
The assembly line is an example of Taylorism in practice, applying scientific management to improve productivity.
-
Ford also introduced higher wages for workers (the $5 workday) to reduce turnover.
-
This system became a model for mass production in factories worldwide, influencing many industries beyond automobiles.
Total Quality Management (TQM):
-
Total Quality Management (TQM) is a management approach focused on continuous improvement and high-quality products.
-
It emphasizes that everyone in an organization, from managers to workers, is responsible for quality.
-
TQM uses data and measurement to identify problems and improve processes.
-
Key principles include customer focus, process improvement, teamwork, and employee involvement.
-
The goal is to reduce errors, improve efficiency, and satisfy customers consistently.
-
TQM became popular in the 1980s and 1990s, influenced by Japanese manufacturing practices.
-
Techniques often include quality circles and regular feedback systems.
"Managers need people to manage—but those people can be frustratingly slow and easily distracted. Explore the psychological and structural “laws” that supposedly govern human effort, then discuss with your team: how do they apply to your preparations for this competition?"
The Hawthorne Effect:
-
The Hawthorne Effect is a concept in psychology where people change their behavior when they know they are being observed.
-
It comes from studies conducted at the Hawthorne Works in the 1920s and 1930s.
-
Researchers were testing lighting, breaks, and work conditions to see how they affected productivity.
-
They found that workers’ productivity improved simply because they were being studied, not just because of changes in conditions.
-
The effect shows that attention and observation can influence performance.
-
It is important in management and organizational psychology, especially when studying employee motivation and workplace behavior.
Hofstadter’s Law:
-
Hofstadter’s Law states: “It always takes longer than you expect, even when you take into account Hofstadter’s Law.”
-
It was proposed by Douglas Hofstadter in his 1979 book Gödel, Escher, Bach.
-
The law shows that tasks often take more time than planned, even with careful planning and experience.
-
It applies to project management, software development, and everyday tasks.
-
Hofstadter’s Law shows the importance of allowing extra time for uncertainty and unexpected problems.
the 90-90 Rule:
-
The 90-90 Rule is a humorous principle about project time estimation.
-
It states: “The first 90% of the work takes 90% of the time, and the last 10% of the work also takes 90% of the time.”
-
The rule shows that finishing a project is often much harder and slower than expected.
-
It applies especially to software development, engineering, and complex projects.
-
The 90-90 Rule warns managers and teams to expect delays and allocate extra time for completing tasks.
-
It is often used to explain why projects often run over schedule despite careful planning.
Conway’s Law:
-
Conway’s Law states: “Organizations design systems that mirror their own communication structure.”
-
It was proposed by Melvin Conway in 1967.
-
This means that the way a team or company communicates affects how their products or software are structured.
-
For example, if a team is divided into separate groups, the software may have separate modules or components that reflect those divisions.
-
Conway’s Law is important in software engineering, organizational design, and project management.
Putt’s Law:
-
Putt’s Law states: “Technology is dominated by two types of people: those who understand what they do not manage and those who manage what they do not understand.”
-
It shows that in organizations, managers often oversee work they do not fully understand, while skilled workers may lack authority.
-
The law is named after Lawrence Putt, who described workplace inefficiencies in a funny way.
-
It shows a common problem where decision-making and expertise are misaligned in companies.
-
Putt’s Law is often referenced in technology, engineering, and management discussions.
-
It emphasizes the importance of matching management roles with actual knowledge and expertise.
Illich’s Law:
-
Illich’s Law states: “The amount of effective work a tool allows is inversely proportional to its complexity.”
-
It was proposed by Ivan Illich.
-
The law suggests that more tools can reduce productivity if they are hard to use.
-
Simple tools are often more efficient and easier to apply than complicated ones.
-
Illich’s Law is important in technology design, workplace efficiency, and management.
-
It warns organizations to consider usability and simplicity when adopting new tools or systems.
Laborit’s Law:
-
Laborit’s Law states: “People will do what they enjoy and avoid what they fear or dislike.”
-
It was proposed by Henri Laborit.
-
The law shows that motivation is driven more by the avoidance of pain than by commands or rules.
-
Laborit’s Law explains why employees perform better when tasks are engaging and meaningful.
-
It suggests that creating a positive work environment increases productivity and reduces resistance.
-
The law emphasizes the role of motivation in designing work processes and leadership strategies.
Brooks’ Law:
-
Brooks’ Law states: “Adding more people to a late software project makes it later.”
-
It was proposed by Frederick P. Brooks Jr. in his 1975 book The Mythical Man-Month.
-
The law shows that new team members require training and coordination, which can slow down progress.
-
Brooks’ Law shows that simply increasing workforce does not solve delays and can sometimes make problems worse.
-
Effective project management requires realistic planning, scheduling, and team communication rather than just adding people.
-
The law emphasizes the importance of managing project size and team structure carefully.
"Maybe studying just 20% of this curriculum will get you a high enough score. The pareto principle suggests that, in any given process, 80% of outcomes come from 20% of inputs. In a project, it implies 20% of the effort can lead to 80% of the results. Discuss with your team: are most people overworking most of the time?"
-
The Pareto Principle is also called the 80/20 rule, which suggests that about 80% of outcomes come from 20% of causes.
-
It was named after Vilfredo Pareto, who noticed that 80% of land in Italy was owned by 20% of the population.
-
The principle is a general observation, not a strict rule; the exact percentages can vary, but the idea is that a small number of causes often produce a large portion of results.
-
The Pareto Principle applies in many areas, such as business (most sales come from a few customers), software development (most bugs are caused by a few errors), and time management (a few key tasks produce most progress).
-
In psychology, it helps people focus on the most important tasks that yield the greatest results.
-
The principle encourages people and organizations to prioritize effort and resources where they will have the most impact.
-
It is a useful heuristic (a rule of thumb) for decision-making and planning, especially when dealing with limited time or resources.

Kanban Example

Gantt Charts Example

Harmonogram Example

Dependencies Example
(colored bars)

Risk Register Example

Stakhanovite Propaganda Example
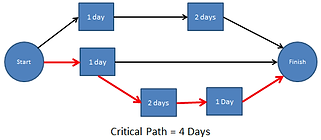
CPM Example

PERT Example

Waterfall Method Example

Command-Control Example

TPS Example

Chaos Engineering Example

Six Sigma Example

Sashimi Model Example
